Tianjin Shipping Index (Jan.7 to Jan.11)
I. Tianjin Shipping Index (TSI)
In Week 2, 2019 (Jan.7 to Jan.11), Tianjin Container Freight Index (TCI) kept increasing. Tianjin Bulk Freight Index (TBI) continued to decrease. Tianjin Domestic Container Freight Index (TDI) decreased. Tianjin Shipping Index (TSI) continued to decrease. The TSI closed at 644.69 points with a decrease of 2.75% from Jan.4 (the last release day of Week 1). The TSI trend is as follows:

The chart above shows the trends of TSI from Jan.2, 2019 to Jan.11, 2019. The value of TSI in Week 2, 2019 is as follows:

II. Tianjin Container Freight Index (TCI)
In Week 2, 2019 (Jan.7 to Jan.11), the trend of Tianjin Container Freight Index (TCI) is as follows:

In week 2, the TCI kept increasing.
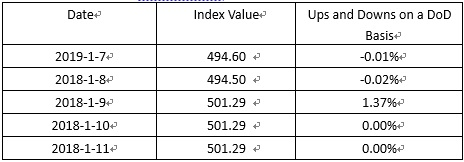
From Jan.7 to Jan.8 (Mon. to Tue.), the freight rates in European route, Mediterranean route and South American route decreased slightly. The freight rate in American route kept steady. The freight rate in Persian Gulf route increased slightly. The TCI decreased 0.03% on two release days. On Jan.9 (Wed.), the freight rates in European route, Mediterranean route, South American route and Persian Gulf route increased slightly. The freight rate in American route decreased. The TCI increased 1.37% on a single day. From Jan.10 to Jan.11 (Thur. to Fri.), the freight rates in each route kept steady, so the TCI was also steady.
The TCI closed at 501.29 points with an increase of 6.66 points (1.35%) from Jan.4 (the last release day of Week 1).
The TCI index value and several ups and downs on a day-on-day basis are as follows:

European/Mediterranean route In January, before the Spring Festival, the market concentrated shipments appeared, and the shipping volume continued to rise. Since last week, the freight rate increased rapidly. At the beginning of this week, the freight rate decreased slightly, and in the middle of the week the freight rate rose again and remained stable. The freight indices in European route, Mediterranean East route and Mediterranean West route increased 0.59%, 1.05% and 1.18% on a week-on-week basis.
American route Although it was in the peak season before the Spring Festival, the importers had already shipped a large amount in advance in order to avoid the risk of trade frictions. The recent shipping volume continued to shrink. This week the freight rate continued to be weak and the freight rate decreased steadily. The freight indices in American West Coast route and American East Coast route decreased 0.60% and 1.62% on a week-on-week basis.
South American route At the beginning of the week, the shipping company lowered the freight rate to improve the utilization rate of the space. Subsequently, some shipping alliances implemented price increases, and the freight rate stopped falling and remained stable at weekend. The freight indices in South American West Coast route, South American East Coast route and Central South American Coast route increased 2.16%, 8.64% and 2.42% on a week-on-week basis.
Persian-Gulf route Recently, the market volume maintained a steady upward trend. In addition, the shipping companies’ contraction capacity appeared. The market freight rate ushered in a strong rising stage. This week the route index value reached the highest point in the past three years, closing at 450.76 points with an increase of 5.43% on a week-on-week basis.
III. Tianjin Bulk Freight Index (TBI)
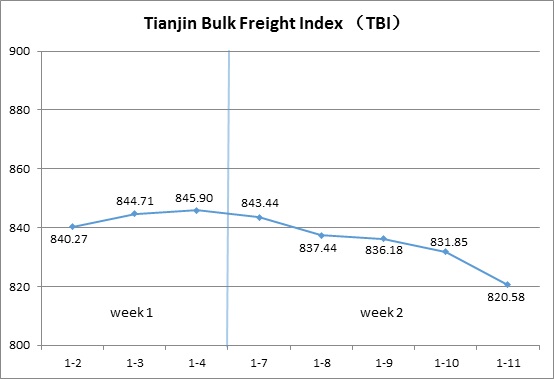
In Week 2, 2019 (Jan.7 to Jan.11), the trend of Tianjin Bulk Freight Index (TBI) is as follows:

In week 2, the TBI presented a continuous downward trend.
From Jan.7 to Jan. 8 (Mon.-Tue.), the freight rate of coal, grain and mineral ore all showed a weak situation, dragging TBI down continuously in two release days with 1.00%. On Jan.9 (Wed.), the freight rates of coal and grain continued to fall, while that of mineral ore stabilized slightly, and the TBI fell by 0.15% on a week-on-week basis.
Subsequently, the decline in the freight rate of coal expanded, and the freight rate of mineral ore fell again, and TBI fell further and finally closed at 820.58 points, down 25.32 points, or 2.99%, from Jan.4 (the last release day of week 1).
The TBI index value and several ups and downs on a day-on-day basis are as follows:

TBCI continued to fall in the week, and the index value closed at 621.38 points, down 20.06 points, or 3.13%, from Jan.4 (the last release day of week 1). Domestic coal stocks were abundant but import demand was cold. For the Panamax, weakening market demand has dragged down freight rates and the freight rate of DBCT to Tianjin route dropped by nearly 5% in the week. In contrast, the freight rate of the Cape ship declined slowly, and that of the Hay Point to Qingdao route declined by nearly 1.3% in the week.
TBGI continued to weaken in the week, and the index value ended at 708.18 points, down 21.40 points, or 2.93%, from Jan.4 (the last release day of week 1). Soybean cargoes in South America were inadequate and there were much empty capacity in the market. Therefore, the freight rate of grain declined as a whole. The freight rate of the U.S. Gulf to Tianjin route fell by more than 2.3% in the week, South America to Tianjin route fell by nearly 4%, and West America to Tianjin route fell by nearly 2%.
TBMI shocked lower in the week, and the index value finally closed at 1132.19 points, down 34.49 points, or 2.96%, from Jan.4 (the last release day of week 1). For the iron ore market, the Pacific and Atlantic markets were divided, and a large number of capacities were concentrated on the Pacific market. Therefore, the freight rate of West Australia to North China route fell by more than 5% in the week. The volume of goods in Brazil was concentrated, and the spot capacity of the market was tightened, and the freight rates of Brazil to Tianjin route increased by more than 4.5% in the week. As for nickel ore, nickel ore pallets were scarce, and the freight rate of Surigao to Tianjin route declined by nearly 2% in the week.
IV. Tianjin Domestic Container Freight Index (TDI)
The trend of Tianjin Domestic Container Freight Index (TDI) in week 2, 2019 (Jan.7-Jan.11) is shown in the chart below.

The TDI in week 2showed a downtrend in fluctuation.
On Jan.7 (Mon.), the Outward Index kept stable and the freight rate of Quanzhou-Tianjin route under Inward Index went downward, which drove TDI decrease slightly, but it recovered steady on Jan.8 (Tue.). From Jan.9 to Jan.10 (Wed.-Thur.), the Outward Index and Inward Index both presented downwards significantly, and the TDI decreased by 5.29% within two consecutive release days. On Jan.11 (Fri.), the TDI finally closed at 784.76 points, 46.19 points (5.56%) lower than that on Jan.4 (the last release day of Week 1).
The TDI index value and several ups and downs on a day-on-day basis are as follows:

Tianjin Domestic Container Outward Freight Index (TDOI) went downwards, and eventually ended at 824.54 points on Jan.11, 42.06 points (4.85%) lower than that on Jan.4 (the last release day of Week 1). The Owners lowered the freight rate for raising the utilization ratio of holds due to part domestic companies were in status of reduction of output, stopping production because of the coming Chinese Spring Festival. In this week, the freight rate of Tianjin-Shanghai route and Tianjin-Guangzhou route showed a downtrend, and the indices respectively decreased by 2.01% and 6.31% compared with last week. While the freight rate of Tianjin-Quanzhou route kept steady.
Tianjin Domestic Container Inward Freight Index (TDII) dropped significantly, and finally closed at 744.98 points on Jan.11, 50.31 points (6.33%) lower than that on Jan.4 (the last release day of Week 1). The shipment volumes of northbound routes continued to decline and the freight rates fell apparently because the companies of ceramic and construction materials in southern area were in holiday mode of Spring Festival in advance. The freight rates of Quanzhou-Tianjin route and Guangzhou-Tianjin route continued to fall in this week, and the freight indices respectively dropped by 6.61% and 7.34% compared with last week. While the freight rate of Shanghai-Tianjin route kept stable and the index remained flat compared with last week.
HEADLINES
- Do shipping markets want Biden or Trump for the win?
- All 18 crew safe after fire on Japanese-owned tanker off Singapore
- Singapore launching $44m co-investment initiative for maritime tech start-ups
- Cosco debuts Global Shipping Industry Chain Cooperation Initiative
- US warns of more shipping sanctions
- China continues seaport consolidation as Dalian offer goes unconditional